Need to calculate the geometric mean of a set of numbers quickly and accurately?
Our Geometric Mean Calculator makes it simple. Whether you’re analyzing financial returns, growth rates, or data in scientific studies, this tool gives you a precise result in seconds.
Just enter your values, and we’ll handle the math—no formulas or spreadsheets needed.
What is the Geometric Mean?
The geometric mean is a type of average that represents the central value of a set of positive numbers by using multiplication instead of addition. Unlike the arithmetic mean, which adds numbers together and divides by the count, the geometric mean multiplies all the values and then takes the n-th root, where n is the total number of values.
In simpler terms, if you’re working with numbers that grow or shrink over time—like investment returns, interest rates, or population growth—the geometric mean gives you a more accurate picture of the ‘average’ change across those values.
Why is the Geometric Mean Important?
The geometric mean is especially useful when dealing with percent changes, ratios, or values that are interdependent. For example, in finance, it helps you find the average return over multiple years while accounting for the compounding effect.
Real-Life Applications
- Finance: Calculating average annual returns or growth rates
- Economics: Creating indexes like inflation or price indexes
- Science: Averaging rates in biology or chemistry
- Social Sciences: Analyzing growth across populations or surveys
- Engineering: Measuring proportional changes in systems
By using the geometric mean, you’re ensuring that every value in the set contributes fairly—especially in situations where data points vary significantly.
Geometric Mean Formula
The geometric mean (GM) of a set of positive numbers is calculated using this formula:
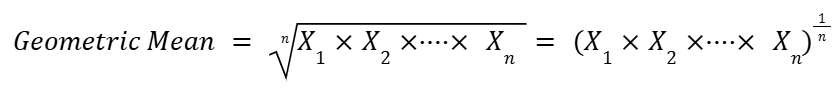
Breaking Down the Formula:
- x₁, x₂, …, xₙ: These are the values in your dataset (all must be positive).
- n: The total number of values in the dataset.
- √n (n-th root): This tells you to take the root based on how many values you have.
- For 2 numbers → take the square root
- For 3 numbers → take the cube root
- And so on…
What Does the Formula Do?
Instead of adding values like the arithmetic mean, the geometric mean multiplies all values together and then “evens them out” by taking the appropriate root. This makes it ideal for datasets involving percent changes, ratios, or rates that are interdependent.
Example in Practice:
If your values are 4 and 16:
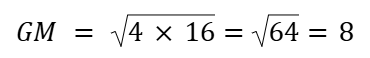
So, the geometric mean is 8 — a value that balances the product of 4 and 16.
This type of averaging gives a more accurate picture in situations where values are not equally weighted or grow multiplicatively over time.
How to Calculate the Geometric Mean
Calculating the geometric mean by hand is a straightforward process, especially when dealing with a small set of positive numbers. Here’s a simple step-by-step guide:
Step-by-Step Guide:
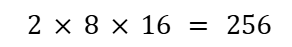
- Multiply all the numbers in the dataset.
Example: For the numbers 2, 8, and 16:
- Count how many numbers are in the set.
In this case, there are 3 numbers. - Take the n-th root of the product, where n is the total number of values.
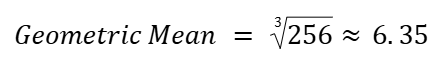
That’s it — the result is your geometric mean!
When Should You Use This Method?
Manual calculation is useful when:
- You’re working with a small set of positive numbers.
- You want to understand the underlying math before relying on a calculator.
- You’re analyzing multiplicative relationships (e.g., investment returns, growth rates, or ratios).
For larger datasets or more complex scenarios, it’s best to use a calculator like the one on this page to save time and reduce errors.
Geometric Mean vs. Arithmetic Mean
Both the geometric mean and the arithmetic mean are ways to find an “average” value, but they serve different purposes depending on the nature of your data.
Key Differences
| Feature | Arithmetic Mean | Geometric Mean |
| Definition | Sum of all values divided by the number of values | n-th root of the product of all values |
| Formula | (x₁ + x₂ + … + xₙ) / n | (x₁ × x₂ × … × xₙ)^(1/n) |
| Best For | Data with consistent values or when changes are additive | Data involving percentages, ratios, or compounding |
| Effect of Outliers | Can be heavily influenced by extreme values | Less sensitive to outliers |
| Requirement | Works with all real numbers | Only valid for positive values |
When to Use Each Mean
- ✅ Use the arithmetic mean when the values are linear or additive in nature. For example:
- Average test scores
- Mean height of a group
- Total expenses divided over time
- ✅ Use the geometric mean when:
- You’re working with growth rates, returns, or multiplicative changes
- The dataset includes large variations or outliers
- You’re analyzing proportional relationships
Example Comparison
Let’s say you have two values: 4 and 900
- Arithmetic Mean:
(4 + 900) / 2 = 452 - Geometric Mean:
√(4 × 900) = √3600 = 60
In this case, the arithmetic mean skews heavily due to the high value (900), while the geometric mean gives a more balanced result, better reflecting the true central tendency when the values differ significantly.
In summary, the arithmetic mean is best for straightforward averages, while the geometric mean shines in situations where data compounds, scales, or spans large ranges. Choosing the right one ensures your analysis is both accurate and meaningful.
Geometric Mean for Negative Numbers
One important limitation of the geometric mean is that it cannot be calculated directly when your dataset includes negative numbers. This is because the geometric mean involves multiplying all the values and then taking a root — and taking the root of a negative product results in an imaginary number, which isn’t useful in most real-world applications.
But this doesn’t mean geometric analysis is impossible with datasets that involve declines or negative growth. In many cases, especially in finance or performance tracking, we’re not working with absolute negative values, but rather percentage changes, such as -10% or +8%.
How to Handle Negative Changes
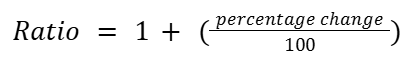
To include negative percentage values in geometric mean calculations, you can convert the changes into ratios (also called growth factors), which are always positive:
Steps:
- Convert percentages to ratios
Use the formula:
Example:
- +8% → 1.08
- -10% → 0.90
- +11% → 1.11
- Calculate the geometric mean of these ratios
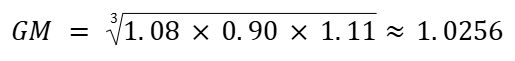
- Convert the result back to a percentage
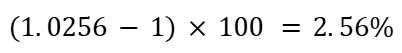
This means an average annual growth rate of 2.56%, despite one year having a negative return.
Key Takeaway
While the geometric mean doesn’t work with raw negative numbers, you can work around this by converting them into positive ratios. This is especially helpful in fields like finance, where returns may fluctuate between gains and losses over time.
Geometric Mean with Zeros in the Dataset
A key limitation of the geometric mean is that it cannot be calculated when the dataset contains a zero. This is because multiplying any number by zero results in zero, and taking the root of that product will also return zero—completely erasing the influence of all the other values in the dataset.
Why Zeros Are a Problem
- The geometric mean is based on multiplication.
- If even one value is zero, the entire product becomes zero.
- This makes the geometric mean mathematically valid, but statistically meaningless—especially if the rest of your data contains important non-zero values.
How to Handle Zeros in Practice
Depending on your context, here are a few ways to approach zeros in your dataset:
✅ 1. Remove Zeros (When Justified)
If a zero represents missing data, a faulty sensor, or a non-response, you may choose to exclude it from the calculation.
Note: This changes your sample size and may impact the meaning of the result.
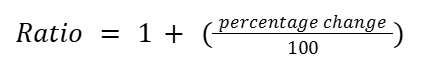
✅ 2. Transform Values into Ratios
If your data represents percentage changes, you can convert them into positive ratios using the formula:
In this case:
- A 0% change becomes 1.00, not zero.
- You can proceed with the geometric mean normally.
✅ 3. Use Imputation Techniques (Advanced)
In scientific or industrial contexts, it’s common to replace zeros with small placeholder values like:
- A very small positive number (e.g., 0.0001)
- Half the smallest detectable value in your dataset
⚠️ Caution: These adjustments should only be made when statistically appropriate and with a clear justification.
Bottom Line
If your dataset contains zeros, you’ll need to either transform, replace, or exclude them to calculate a meaningful geometric mean. Always consider the context of your data before making adjustments, and be transparent about any changes when interpreting results.
Examples of Geometric Mean
Understanding the geometric mean becomes easier when you see how it works in real-world situations. Below are two common use cases—in finance and the social sciences—where this type of average provides more meaningful insights than the arithmetic mean.
Example Usage in Finance
In finance, the geometric mean is essential for accurately calculating investment returns over time, especially when those returns fluctuate. It accounts for compounding and provides the true average rate of return over multiple periods.
📈 Why It Matters
Using the arithmetic mean to average returns can be misleading when gains and losses vary from year to year. The geometric mean, on the other hand, reflects the actual effect of compounding, showing how your investment truly performed.
💡 Example: 3-Year Investment Returns
Let’s say your investment grows and shrinks like this over three years:
- Year 1: +10%
- Year 2: -5%
- Year 3: +12%
Convert these to growth factors:
- 1.10, 0.95, 1.12
Now calculate the geometric mean:
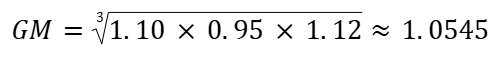
Convert back to a percentage:
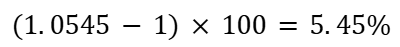
Even though the arithmetic average of the yearly changes is 5.67%, the geometric mean shows your real return accounting for volatility.
✅ Use this calculator to simply input the annual returns, and it will instantly show your average compound return—no formulas required.
Example Usage in Social Sciences
In the social sciences, the geometric mean is often used when analyzing growth rates or data that changes proportionally, such as population studies or economic development indicators.
🌍 Example: Population Growth Rate
Suppose you’re studying the population growth of a region over five years, and the annual growth rates are:
- 2.0%, 1.8%, 2.1%, 1.5%, and 2.3%
Convert these to growth factors:
- 1.020, 1.018, 1.021, 1.015, 1.023
Now calculate:

Back to percentage:
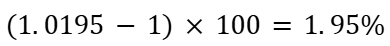
This gives a more accurate measure of sustained growth than simply averaging the percentages arithmetically.
🧪 Case Study: Economic Improvement in a Low-Income Area
A community development study tracks average household income changes over 10 years in a previously underserved area. Because the data fluctuates and involves percentage-based improvements, researchers use the geometric mean to summarize the true average annual improvement, helping policy makers understand the long-term trend without distortion from outlier years.
The geometric mean ensures precision and fairness in how growth or decline is measured—whether it’s money in your portfolio or lives in a population study.
Frequently Asked Questions (FAQs)
What happens if I enter non-numeric data?
Our calculator only accepts numeric values. If you enter text, symbols, or unsupported characters, the tool will display an error and prompt you to correct your input. Make sure all values are positive numbers (or valid ratios in financial mode).
Can I include negative numbers or zeros?
No. The geometric mean requires positive numbers only. If your dataset includes negative numbers or zeros, you’ll need to convert them into growth factors (e.g., 1 + percentage/100) before calculating. See the relevant sections above for guidance.
How do I interpret the geometric mean result?
The result represents the average multiplicative rate of your values. In practical terms:
- In finance, it shows the average return per period after compounding.
- In science or demographics, it reflects the average proportional change across your dataset.
A geometric mean gives a more accurate picture when dealing with ratios, rates, or values that multiply over time.
How many numbers can I enter at once?
You can enter as many values as needed, separated by commas or spaces. Just be sure they’re all valid positive numbers.
Is this calculator accurate?
Yes. Every result is computed using the standard geometric mean formula, and the logic is verified to ensure precision across use cases. We’re committed to delivering reliable and trustworthy results every time.